Turning Data into Decisions.
We design AI-powered dashboards that go beyond visuals — uncovering patterns, automating insights, and helping you make smarter business decisions in real time.
What We Offer
AI-Driven Insights
Go beyond static dashboards. We implement machine learning models that detect trends, predict outcomes, and flag anomalies automatically.
Custom Data Visualizations
We craft intuitive visuals — from KPIs and growth funnels to interactive filters and geospatial data maps.
Multi-Source Integration
Merge all your data into one intelligent dashboard. From Odoo to Google Sheets — everything stays in sync.
Automation & Alerts
Get automated email and chat alerts based on business triggers or AI-detected anomalies.
End-to-End Setup
We handle everything — data cleaning, backend setup, UI design, and secure cloud deployment.
Our DAQ Philosophy
Design
Elegant, responsive dashboards that present complex data simply and beautifully.
Automation
AI pipelines that update your visuals automatically — no manual refreshes or queries.
Quality
Accurate, consistent, and optimized dashboards that scale with your data and business.
Intelligent Dashboard Showcase
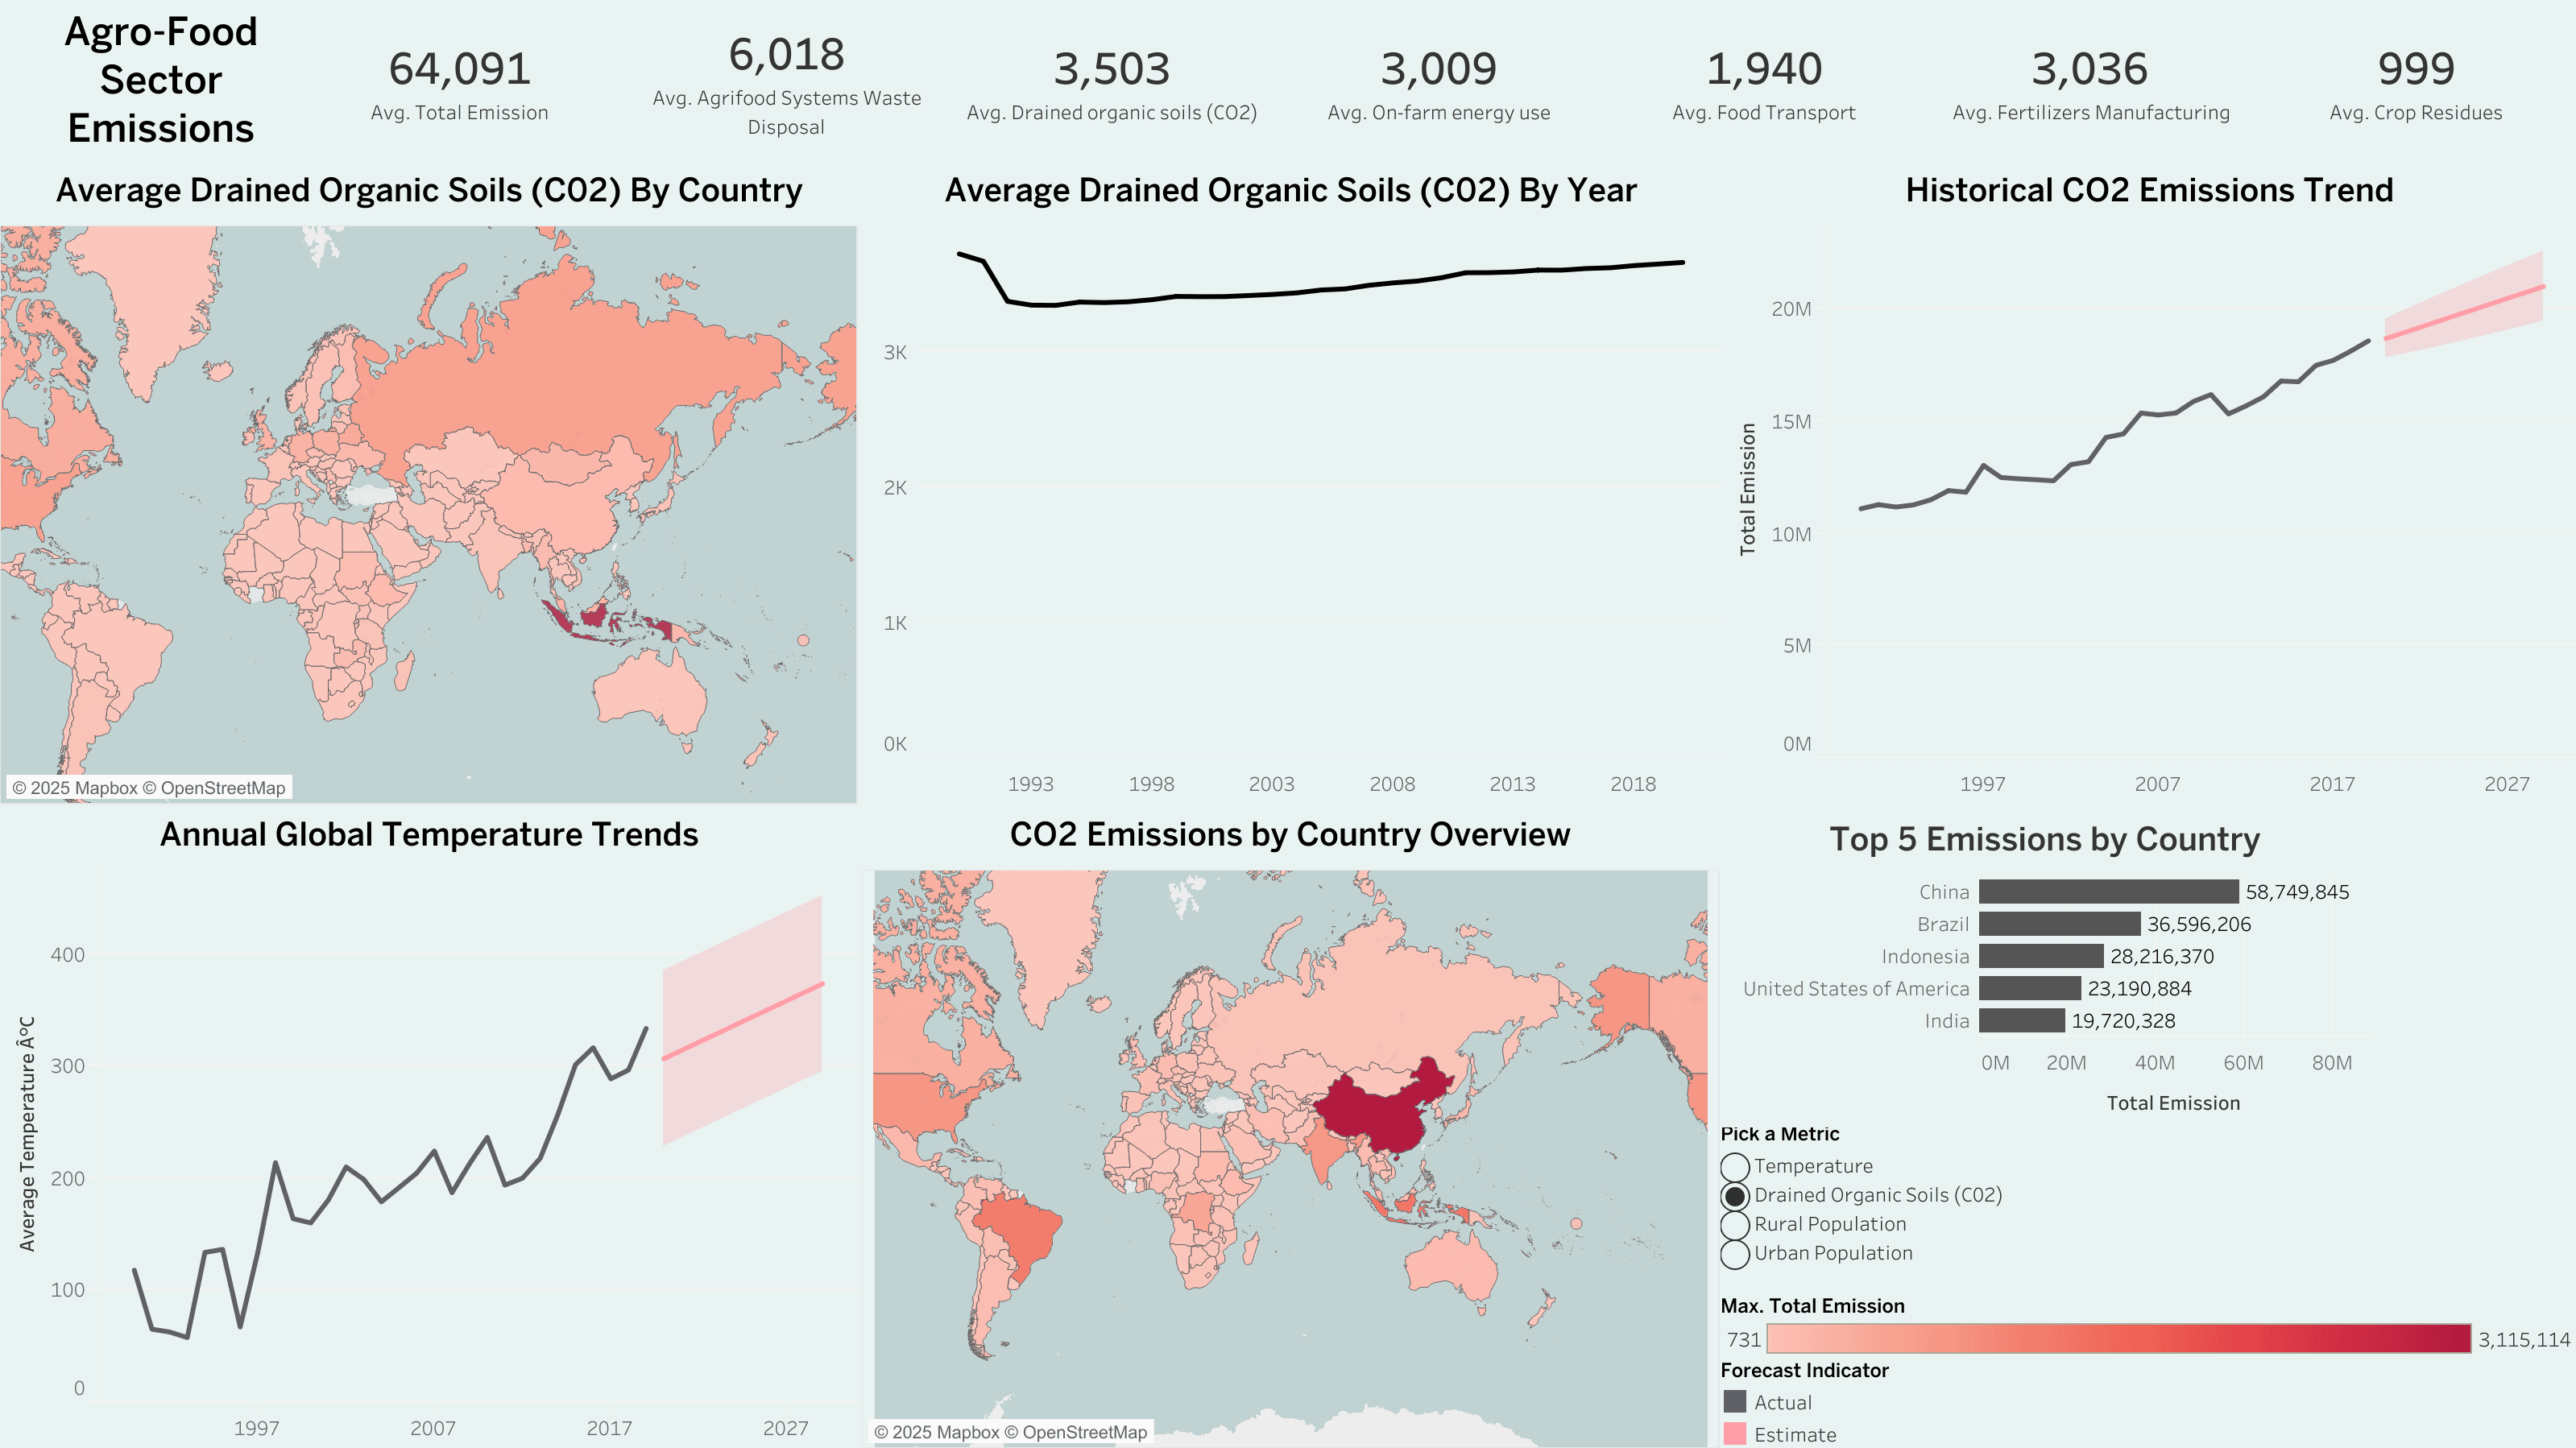
Agro-Food Sector CO₂ Emissions Dashboard
An intelligent, AI-powered analytical dashboard designed to track and forecast CO₂ emissions across the agro-food sector globally. The system visualizes trends in drained organic soils, fertilizer use, temperature variations, and national emission patterns — enabling policy planners to identify critical intervention points for sustainable food systems.
The dashboard integrates predictive modeling and live data visualization, providing both historical trends and future emission estimates for data-driven environmental action.
View Dashboard →